• explore

    Stock Chart Ai

    meta stock analysis

    Welcome To Slide with video Slide 12
  • 16,000+ stocks

    Instant Analysis

    plus crypto-currencies!

    Instant Analysis 2
  • Market Condition,

    Market Timing,

    and Technical Analysis

    Market Slide 3
  • Robo-Analyst

    Daily Trading Ideas

    plus proprietary reversal indicator!

    Trading Ideas Slide 4

We knew there had to be a better way to invest.

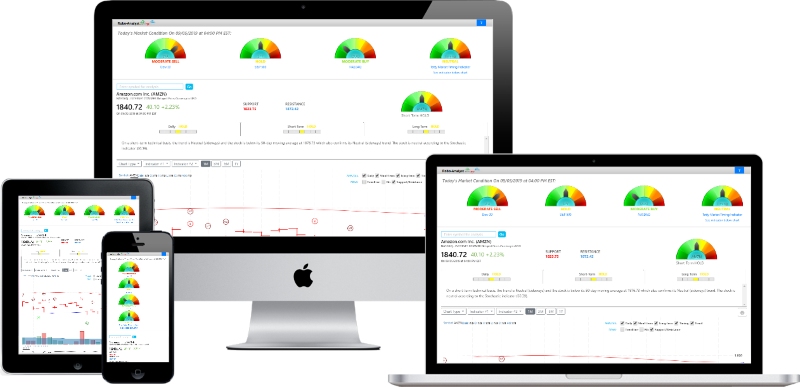
Get instant analysis on more than 16,000 stocks, funds and cryptocurrencies. The Robo-Analyst advanced software analyzes and interprets the most widely-used indicators; with a Daily, Short-term and Long-term outlook. The software explains the analysis simply on the chart and in text to help investors make a quick, informed decision.

Daily Trading Ideas

We offer a daily list of stocks expected to go down or up in the short-term based on the Robo-Analyst opinions along with a winning trading strategy.

Totty Market Timing Indicator ™

The proprietary reversal indicator that analyzes the broad market for general market risk BEFORE you trade! Updated daily for easy market timing.

Get Instant Analysis on more
than 16,000 stocks and crypto-currencies + Daily Stock Picks!

Growing developer community.

counter-1
1
Robo-Analyst

counter-2
16000
Stocks

counter-3
36,000
Picks

counter-4
7,000,000
Data Points

Robo-Analyst advanced software analyzes and interprets the most widely-used indicators.

Proprietary reversal indicator that analyzes the broad market for general market risk BEFORE you trade!

service-icon

Daily Opinion

Daily stock analysis with buy, moderate buy, outperform, hold, underperform, moderate sell, and sell signals.

service-icon

Short Term Opinion

Short term stock analysis with buy, moderate buy, outperform, hold, underperform, moderate sell, and sell signals.

service-icon

Long Term Opinion

Long term stock analysis with buy, moderate buy, outperform, hold, underperform, moderate sell, and sell signals.

service-icon

Totty Market Timing Indicator

Market timing indicator with bullish and bearish indicators to mark a market trend.

service-icon

Daily Trading Ideas

A daily list of stocks expected to go down or up in the short-term based on our Robo-Analyst opinions along with a winning trading strategy.

service-icon

Standard Charting Indicators

Indicators such as SMA50/SMA200, TMA20, EMA20, EMA50, SAR, Bollinger Bands, TMTI, RSI/ATR, MACD, Stochastic, Force Index, and Elder Ray.

“Whether you’re a beginner or an expert, you’ll benefit from this amazing tool!”

Widely used indicators; explained in simple to understand terms.

REAL-TIME ANALYSIS EXPLAINED

READY FOR THE FREE TRIAL?

Case Studies

Case studies show the Robo-Analyst is remarkably accurate.

  • Cirrus Logic

    Cirrus Logic

    Robo-Analyst

    Case Study #6 Analysis

  • GroupOn

    GroupOn

    Robo-Analyst

    Case Study #5 Analysis

  • Facebook Long Term

    Facebook Long Term

    Robo-Analyst

    Case Study #4 Analysis

  • Amazon

    Amazon

    Robo-Analyst

    Case Study #3 Analysis

  • Google

    Google

    Robo-Analyst

    Case Study #2 Analysis

  • Facebook

    Facebook

    Robo-Analyst

    Case Study #1 Analysis

Everything you need automatically analyzed on one screen.

  • $ABBV AbbVie Inc Stock Robo Analyst October 31 2020 #ABBV

    $ABBV AbbVie Inc Stock Robo Analyst October 31 2020 #ABBV

    October 31, 2020

    AbbVie Inc (ABBV) “On a long-term technical basis, the stock (ABBV) is trading below its 200-day moving average which generally implies it is in a negative trend. The stock has support at 74.63 and 65.30. If the stock breaks down through support at 74.63 then it will probably continue lower to 65.30. The stock has […]

  • $NLY Annaly Capital Management Inc Stock Robo Analyst October 31 2020 #NLY

    $NLY Annaly Capital Management Inc Stock Robo Analyst October 31 2020 #NLY

    October 31, 2020

    Annaly Capital Management Inc (NLY) “On a long-term technical basis, the stock (NLY) is trading below its 200-day moving average which generally implies it is in a negative trend. The stock has support at 6.99 and 6.26. If the stock breaks down through support at 6.99 then it will probably continue lower to 6.26. The […]

  • $UAL United Airlines Holdings Inc Stock Robo Analyst October 31 2020 #UAL

    $UAL United Airlines Holdings Inc Stock Robo Analyst October 31 2020 #UAL

    October 31, 2020

    United Airlines Holdings Inc (UAL) “On a long-term technical basis, the stock (UAL) is trading below its 200-day moving average which generally implies it is in a negative trend. The stock has support at 33.64 and 31.22. If the stock breaks down through support at 33.64 then it will probably continue lower to 31.22. The […]

  • $ZNGA Zynga Inc Stock Robo Analyst October 31 2020 #ZNGA

    $ZNGA Zynga Inc Stock Robo Analyst October 31 2020 #ZNGA

    October 31, 2020

    Zynga Inc (ZNGA) “On a long-term technical basis, the stock (ZNGA) is trading above its 200-day moving average which generally implies it is in a positive trend. However, the stock has broken down through an important fibonacci fan trendline at 9.70 suggesting the next level of support is 8.90. The long-term uptrend has now turned […]

  • $FE FirstEnergy Corp Stock Robo Analyst October 31 2020 #FE

    $FE FirstEnergy Corp Stock Robo Analyst October 31 2020 #FE

    October 31, 2020

    FirstEnergy Corp (FE) “On a long-term technical basis, the stock (FE) is trading below its 200-day moving average which generally implies it is in a negative trend. The new level of support is at 27.93. The stock has support at 27.93 and 22.85. If the stock breaks down through support at 27.93 then it will […]

  • $BSX Boston Scientific Corporation Stock Robo Analyst October 31 2020 #BSX

    $BSX Boston Scientific Corporation Stock Robo Analyst October 31 2020 #BSX

    October 31, 2020

    Boston Scientific Corporation (BSX) “On a long-term technical basis, the stock (BSX) is trading below its 200-day moving average which generally implies it is in a negative trend. The stock has support at 33.77 and 24.10. If the stock breaks down through support at 33.77 then it will probably continue lower to 24.10. The stock […]

  • $PLUG Plug Power Inc Stock Robo Analyst October 31 2020 #PLUG

    $PLUG Plug Power Inc Stock Robo Analyst October 31 2020 #PLUG

    October 31, 2020

    Plug Power Inc (PLUG) “On a long-term technical basis, the stock (PLUG) is trading above its 200-day moving average which generally implies it is in a positive trend. The stock has support at 13.86 and 11.70. If the stock breaks down through support at 13.86 then it will probably continue lower to 11.70. The stock […]

  • $TSLA Tesla Inc Stock Robo Analyst October 30 2020 #TSLA

    $TSLA Tesla Inc Stock Robo Analyst October 30 2020 #TSLA

    October 30, 2020

    Tesla Inc (TSLA) “On a long-term technical basis, the stock (TSLA) is trading above its 200-day moving average which generally implies it is in a positive trend. However, the stock has recently broken down through an important fibonacci fan trendline at 389.15 suggesting the next support level is at 351.30. This weakness suggests the long-term […]

  • $UAA Under Armour Inc Stock Robo Analyst October 30 2020 #UAA

    $UAA Under Armour Inc Stock Robo Analyst October 30 2020 #UAA

    October 30, 2020

    Under Armour Inc (UAA) “On a long-term technical basis, the stock (UAA) is trading above its 200-day moving average which generally implies it is in a positive trend. The stock has support at 12.42 and 11.63. If the stock breaks down through support at 12.42 then it will probably continue lower to 11.63. The stock […]

Robo-Analyst

Stock Analysis in a flash!

Pricing

Risk-Free 1-mo Trial

Starting at

FREE

Limited time availability.

Valid for one month

Robo-Analyst Intraday & Daily Stock Picks

End of Day only

Starting at

$$

Perfect tool to look after your investments

Includes: Robo-Analyst (End-of Day)

Intraday+Daily Picks

Starting at

$$$

Perfect for active investors

Includes: Robo-Analyst (Intraday) & Daily Stock Picks

Meta analysis of thousands of popular stocks.

FB

GOOGL

QQQ

TSLA

AMZN

SPY

DIA

AAPL

MSFT

JPM

V

INTC

CSCO

BA

ADBE

PYPL

CRM

ORCL

COST

NFLX

IBM

NVDA

SBUX

BRK.B

What users are saying about the Robo-Analyst!

“I assure you all… this thing WORKS!”

John G.

“I’ll sum up my opinion this way WOW, A heck of a lot easier than typing in averages on prophet java charts.”

Eddie

“smartest and most efficient software I have ever used”

Blazo D.

“I like to reference the analysis to make sure I’m on the right track!”

Eli M.

Get started today.

Market Condition, Market Timing, and Technical Analysis on any stock!

Join Us