>>> Join us to access robo analyses for over 16,000+ stocks! <<<
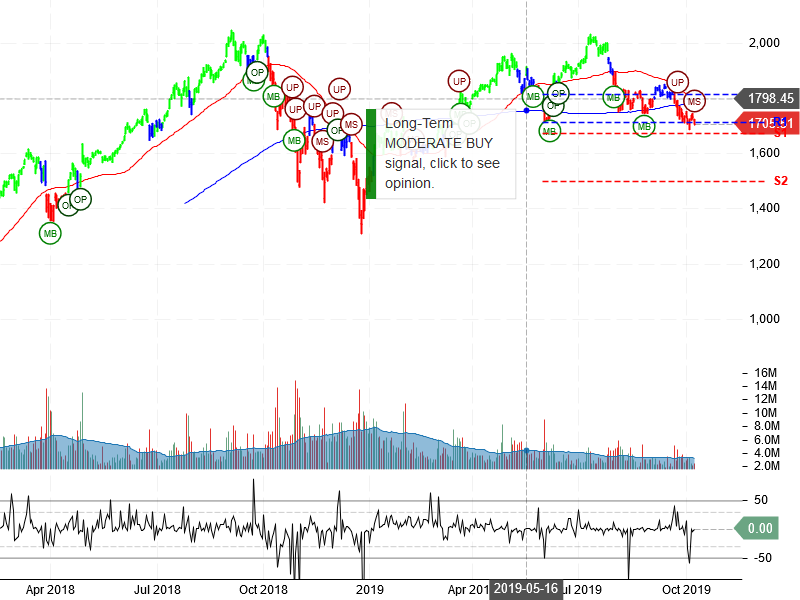
Amazon.com Inc (AMZN) “On a long-term technical basis, the stock (AMZN) is trading below its 200-day moving average which implies it is in a negative trend.
The stock has support at 1672.00 and 1498.25. If the stock breaks down through support at 1672.00 then it will probably continue lower to 1498.25. The stock has resistance at 1712.32 and 1815.75. If the stock breaks up through resistance at 1712.32 then it will probably continue higher to 1815.75. The 200-day moving average is at 1782.85. This will also act as resistance. The stock’s long-term uptrend has changed into a sideways or downtrend. In this case, the stock will either go sideways for a while or sell-off back to where it started prior to the latest big upmove. This is a risky time for the stock, so be careful. Use caution during times like these, as the stock will be more volatile. Pay close attention to the Short-Term and Daily Opinion. The stock is extremely oversold according to the Stochastic Indicator (21.58), so look for a possible rebound soon. Confirm this with the Short-Term Opinion and Daily Opinion to keep from exiting prematurely.”
>>> Join us to access robo analyses for over 16,000+ stocks! <<<

