>>> Join us to access robo analyses for over 16,000+ stocks! <<<
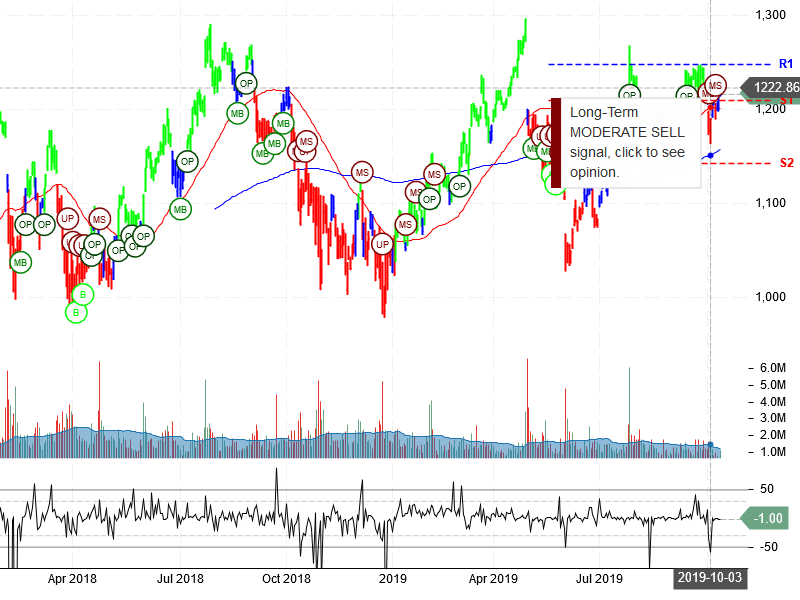
Alphabet Inc (GOOGL) “On a long-term technical basis, the stock (GOOGL) is trading above its 200-day moving average, but has broken through an important support level, which implies it is in a neutral trend.
The stock has support at 1209.39 and 1142.75. If the stock breaks down through support at 1209.39 then it will probably continue lower to 1142.75. The stock has resistance at 1248.02 and 1357.79. If the stock breaks up through resistance at 1248.02 then it will probably continue higher to 1357.79. The 200-day moving average is at 1156.99. This will also act as support. The stock’s long-term uptrend has changed into a sideways or downtrend. In this case, the stock will either go sideways for a while or sell-off back to where it started prior to the latest big upmove. This is a risky time for the stock, so be careful. Use caution during times like these, as the stock will be more volatile. Pay close attention to the Short-Term and Daily Opinion. The stock is neutral according to the Stochastic Indicator (48.57).”
>>> Join us to access robo analyses for over 16,000+ stocks! <<<

