>>> Join us to access robo analyses for over 16,000+ stocks! <<<
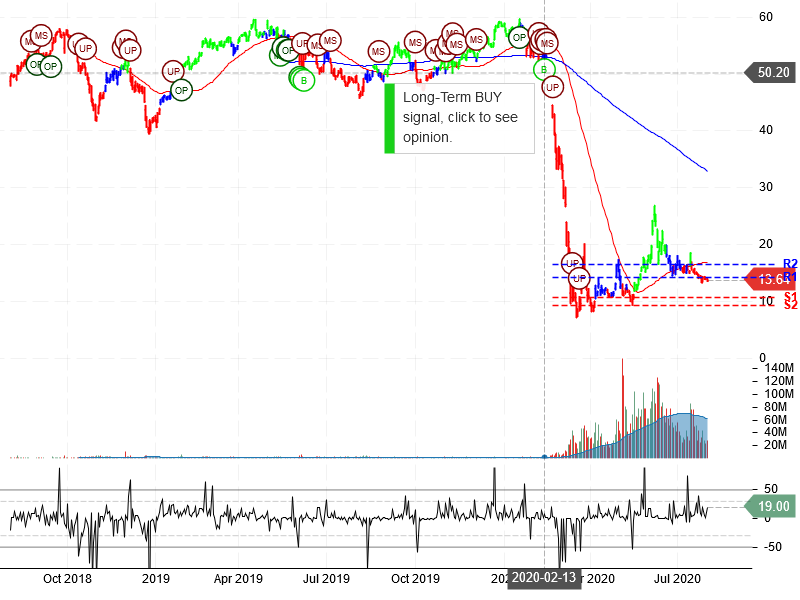
Norwegian Cruise Line Holdings Ltd (NCLH) “On a long-term technical basis, the stock (NCLH) is trading below its 200-day moving average which generally implies it is in a negative trend.
The stock has support at 10.65 and 9.24. If the stock breaks down through support at 10.65 then it will probably continue lower to 9.24. The stock has resistance at 14.18 and at 16.45. If the stock breaks up through resistance at 14.18 then it will probably continue higher to 16.45. The 200-day moving average is at 32.97. This will also act as resistance. However, the stock has broken out of its long-term downtrend according to the fibonacci fan, which is significant. If the stock can form new support above 10.65 look for a rally to previous highs. The stock is extremely oversold according to the Stochastic Indicator (13.02), and turning up, which suggests a pause or possible rebound, especially if near support. Confirm this with the Short-Term and Daily Outlook to keep from exiting prematurely.”
>>> Join us to access robo analyses for over 16,000+ stocks! <<<

